
 Register
Search
Keywords
Latest topics
Affiliates

Base SAS 9.3 ODS Destination
Page 1 of 1

Base SAS 9.3 ODS Destination
![]() pallav Mon Mar 26, 2012 12:05 pm
pallav Mon Mar 26, 2012 12:05 pm
There is a change in welcome screen for windows environment when you start the SAS.
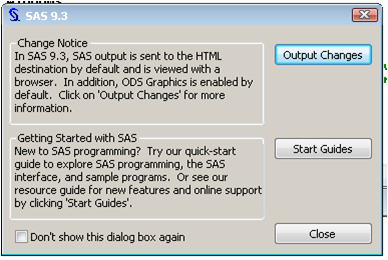
In SAS 9.2 default output was in form of Listing output and you required to put ods statement to create output in HTML form.
In SAS 9.3, output in the SAS windowing environment is created by default in HTML.
Previously, to generate the graphs you required to have SAS/GRAPH as a separate license component but now no separate license is required. SAS/GRAPH is now a part of Base SAS.
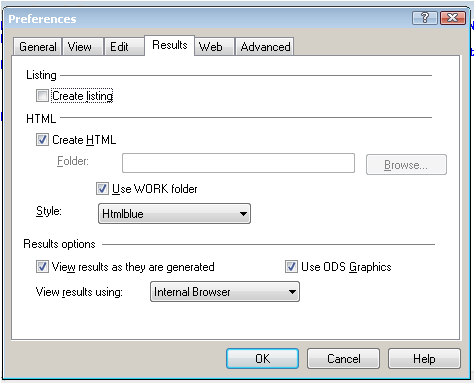
In addition, ODS Graphics is enabled by default. Graphs are integrated with tables, and all output is displayed in the same HTML file using a new style. This new style, HTMLBlue, is an all-color style that is designed to integrate tables and modern statistical graphics. You can view and modify the default settings by selecting Tools Options Preferences from the menu at the top of the main SAS window.
Still you can change the defaults by going to tool menu...
The ODS Graphics Designer has the following changes and enhancements:
In SAS 9.2 default output was in form of Listing output and you required to put ods statement to create output in HTML form.
In SAS 9.3, output in the SAS windowing environment is created by default in HTML.
Previously, to generate the graphs you required to have SAS/GRAPH as a separate license component but now no separate license is required. SAS/GRAPH is now a part of Base SAS.
In addition, ODS Graphics is enabled by default. Graphs are integrated with tables, and all output is displayed in the same HTML file using a new style. This new style, HTMLBlue, is an all-color style that is designed to integrate tables and modern statistical graphics. You can view and modify the default settings by selecting Tools Options Preferences from the menu at the top of the main SAS window.
Still you can change the defaults by going to tool menu...
The ODS Graphics Designer has the following changes and enhancements:
- inclusion with Base SAS
- ODS style changes
- ability to start the designer from the SAS menu bar
- more options for saving a graph
- enhanced data assignment options
- enhanced plot properties
pallav- Posts : 98
Join date : 2012-03-14
Location : Ahmedabad
» New Procedure added to Base SAS 9.3
» Enhanced Base SAS Procedures
» Assignment 2 (Base SAS)
» Assignment 3 (Base SAS)
» Assignment 6 (Clinical Base)
» Enhanced Base SAS Procedures
» Assignment 2 (Base SAS)
» Assignment 3 (Base SAS)
» Assignment 6 (Clinical Base)
Page 1 of 1
Permissions in this forum:
You cannot reply to topics in this forum|
|
|
» SAS Enterprise Guide: Explore Data before you start Analysing
» Predictive Analytics
» Creating Frequency Report and Creating User Defined styles in SAS Add-In for Microsoft Office
» Prompted Reports in BI Dashboard
» Free SAS Webinar : Getting Started with SAS Hash Object
» Which SAS procedure changes the name of a permanent format for a variable stored in a SAS data set?
» What is written to SAS Log?
» SAS Portal and BI Dashboard: Customizing the Tabs